

New dahboard


Hey there,
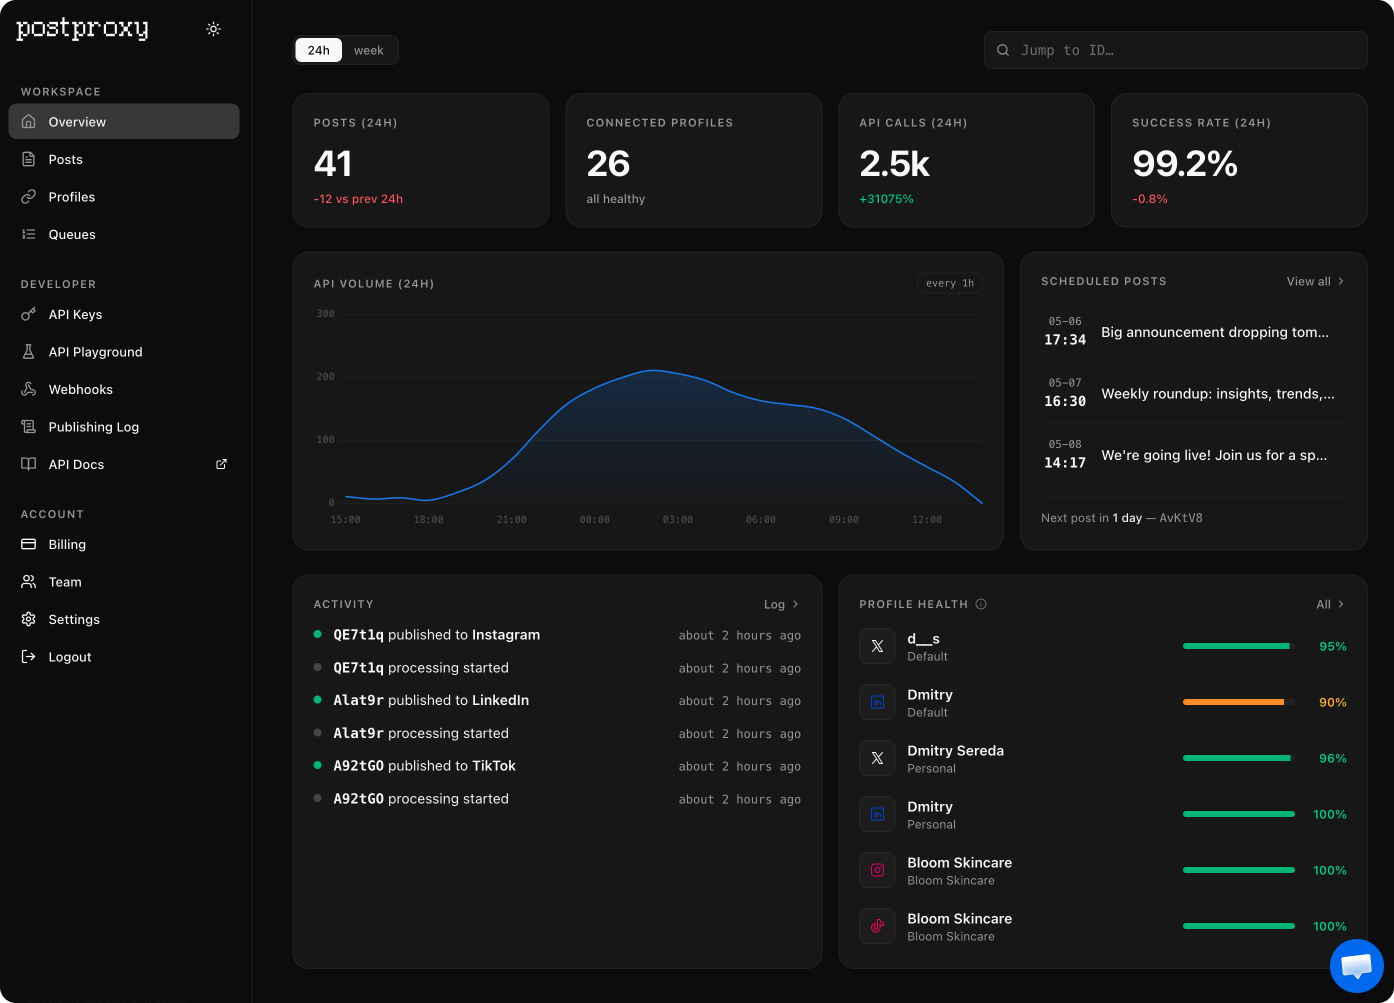
We’ve added a new Overview dashboard.
It gives you a quick view of what’s happening in your Postproxy account without digging through logs or jumping between pages.
You’ll see things like:
-
posts created, API call volume and success rate over last 24h/week
-
recent activity across platforms
-
scheduled posts
-
profile health (yep, introduced a new metric showing how many posts are failing, if ever)
This is especially useful if you:
-
run automated publishing pipelines
-
manage multiple accounts or brands
-
want to catch issues early without checking every post manually
It’s not meant to replace detailed logs or analytics. Those are still there. But if you use web app extensively, now you don’t have to piece together what’s happening from five different screens.
Cheers,
Dmitry